Custom Watchlist Columns Based on the TTM Squeeze Histogram
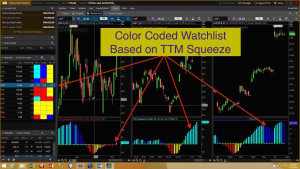
Thinkorswim TTM Squeeze Watchlist
With this tool, just a quick glance is all it takes to see which stocks are trending. This video shows you how to display the TTM Squeeze histogram colors in a custom watchlist column. Add multiple columns to the watchlist, each referencing a different time frame. Easily see which stocks have the TTM Squeeze direction aligned across multiple time frames. Free custom code is included below. Just follow instructions in the video to copy/paste this code and create your very own custom watchlist columns.
No source code is disclosed as the Thinkorswim platform provides access to the plots while keeping the proprietary code out of sight.
Learn More:
Click and drag interface to build custom watchlist columns. No code experience required:
Thinkorswim Condition Wizard Watchlist
DISCLAIMER: I AM NOT A CERTIFIED FINANCIAL ADVISOR AND NOTHING IN THIS VIDEO OR TEXT IS AN ADVERTISEMENT OR RECOMMENDATION TO BUY OR SELL ANY FINANCIAL INSTRUMENT. NOR IS THIS VIDEO OR TEXT INTENDED TO INSTRUCT YOU ON HOW TO MAKE BUY OR SELL DECISIONS USING ANY OF THESE INDICATORS.
*Thinkorswim is a chart analysis platform offered by Charles Schwab: https://www.schwab.com/
Charles Schwab provides financial services including the trading of Stocks, Futures, Options and Forex.
Please be sure to share this page with your friends and colleagues. Leaving comments below is the best way to help make the content of this site even better.
Here is the code used to create your own custom watchlist columns as demonstrated in the video below.
input price = CLOSE;
input length = 20;
input nK = 1.5;
input nBB = 2.0;
input alertLine = 1.0;
def squeezeHistogram = TTM_Squeeze(price, length, nK, nBB, alertLine).Histogram;
plot hist = if squeezeHistogram>= 0 then if squeezeHistogram > squeezeHistogram[1] then 2 else 1 else if squeezeHistogram < squeezeHistogram[1] then -2 else -1;
AssignBackgroundColor(if squeezeHistogram >= 0 then if squeezeHistogram > squeezeHistogram[1] then color.CYAN else color.BLUE else if squeezeHistogram < squeezeHistogram[1] then color.RED else color.YELLOW);
hist.assignvaluecolor(if squeezeHistogram >= 0 then if squeezeHistogram > squeezeHistogram[1] then color.CYAN else color.BLUE else if squeezeHistogram < squeezeHistogram[1] then color.RED else color.YELLOW);
What does it mean when all column are the same color? Light Blue for instance
My first guess is that each column is set to the same time frame.
I’ve loaded the ttm dot squeeze on to my watch list, I cant figure out how to make it count the red dot on a one min chart.
sorry pete .no need to reply, stupid me I didn’t catch that in the video. I did find my answer in the Q&A Forum
Excellent! Thanks for the update.
Thanks for your prompt response. Will the color codes be accurate if the aggregation on the chart is 180 days and 195 minutes. I want to use this for options and hence the longer time frame. Since there is no way I can extend the time frame on the colors they may not be in sync. Thanks, Srini
I did make it clear that the only aggregation periods supported are those you can select from the code editor. When you click on the selector, you did not find 195 minutes in the list of available aggregations. So why are you asking about 195 minutes? 195 minutes is not supported in a Watchlist column. For a list of supported aggregation periods review this web page: http://toslc.thinkorswim.com/center/reference/thinkScript/Constants/AggregationPeriod.html
getting a lot of NAN back boxes on the watchlist..is there an update to the code?
Working fine on my end. I just tested it.
Pete it works fine on my end as well initially, but on occasion as the day progresses black box with “NAN” show up. I use this to watch the 5, 15,30m time frame for squeezes…what your email..I can send you a screen shot
There is nothing in the code that can cause this. If/when it occurs this is entirely a problem created within the platform. This cannot be addressed by changing the code.
I have Extended Hours ticked for Futures, while I do not have the same for Equities. Can I then use separate sets of columns in 2 different watchlists? When I change the Watchlist, will the right set of TTM Sqz colors come up?
If I understand your question, yes it should work. Just give it a try and test it out.
Thanks for your response. Are the columns then saved as part of a watchlist i.e when I switch between watchlists, will the columns settings for TTM sqz be appropriately selected?
Thanks, Jagdish
There is no way to save the columns of a watclist. You can only save the contents. The Ticker symbols themselves.
Hi Hahn,
Just a query on the color code for TTM Squeeze. Can I change the code to use this for 6 months or 180 days and 195 minutes aggregation. Appreciate your response. Thanks, Srini
The only aggregation periods supported are the ones you can select at the top of the code editor. The code has absolutely no impact on the aggregation period.
High Peter, I got the TTM watch list copied to my TOS platform. The weekly and daily color shade of the histogram bar are accurate, the hourly is not? any advice to rectify? Kind regards~Louis
The hourly is accurate. The problem is your chart settings. Check the solution provided in this post for the answer: https://www.hahn-tech.com/ans/hourly-adx-watchlist-not-matching-hourly-chart/
Great Video and presentation Hahn. You have given examples for stocks. Can this be TTM squeeze color coding be used for a futures watchlist as well – YM / RTY etc. Also, when I use this for futures, for some periods there is a display of NaN. What does this mean or signify?
The code should plot colors for futures just as it does for stocks. If you are getting NaN instead of a color, this is due to some processing error in the platform. NaN means “Not A Number”. Which happens when the platform cannot compute a value. This most often occurs while markets are close, or during periods of extremely high market activity.
can I get color of histogram and associated number in the table? I can see the number only if I highlight the particular stock. But i would like to see color and number associated with it at the same time
The color of the histogram for TTM is provided in another video. Look to the menu at the left sidebar. There are two for TTM Squeeze. One does the dots, the other does the histogram.
what about other time frame not in the drop down?Other than daily ,4hr etc…
Those are the only time frames available. There are no work-arounds.