Custom Watchlist Columns Colored to Match Dots on TTM Squeeze Centerline
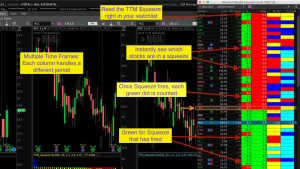
Thinkorswim Watchlist TTM Squeeze
This video shows how to add a column to any watchlist displaying red or green to show you which stocks are in a squeeze. Additionally, this code will count the number of green dots since the last squeeze ended. Zeros mean the stock is in a squeeze. Values greater than zero indicate a stock that has exited the squeeze and is potentially ready for a big move. You can sort the watchlist by this column so you can spot the stocks that have just recently exited the squeeze.
Be sure to watch the video so you understand how to install it. This indicator compliments a previous video we published that displays the colors of the TTM Squeeze histogram in a watchlist. Use these together to create a ‘radar screen’ similar to those used in TradeStation. In a single glance you can see stocks that are ready to make a move and which direction the indicator is predicting.
John Carter’s TTM Squeeze is a licensed study available free on the Thinkorswim platform. This code does not expose any source code as it is fully protected by the Thinkorswim platform.
Learn More:
Click and drag interface to build custom watchlist columns. No code experience required:
Thinkorswim Condition Wizard Watchlist
DISCLAIMER: I AM NOT A CERTIFIED FINANCIAL ADVISOR AND NOTHING IN THIS VIDEO OR TEXT IS AN ADVERTISEMENT OR RECOMMENDATION TO BUY OR SELL ANY FINANCIAL INSTRUMENT. NOR IS THIS VIDEO OR TEXT INTENDED TO INSTRUCT YOU ON HOW TO MAKE BUY OR SELL DECISIONS USING ANY OF THESE INDICATORS.
*Thinkorswim is a chart analysis platform offered by Charles Schwab: https://www.schwab.com/
Charles Schwab provides financial services including the trading of Stocks, Futures, Options and Forex.
Please be sure to share this page with your friends and colleagues. Leaving comments below is the best way to help make the content of this site even better.
Watch the video, Thinkorswim Watchlist TTM Squeeze below:
input price = CLOSE;
input length = 20;
input nK = 1.5;
input nBB = 2.0;
input alertLine = 1.0;
def squeezeDots = TTM_Squeeze(price, length, nK, nBB, alertLine).SqueezeAlert;
def alertCount = if squeezeDots[1] == 0 and squeezeDots == 1 then 1 else if squeezeDots == 1 then alertCount[1] + 1 else 0;
plot data = alertCount;
data.AssignValueColor(if alertCount > 0 then Color.BLACK else Color.WHITE);
AssignBackgroundColor(if alertCount == 0 then Color.RED else Color.GREEN);
Hi Pete, setup the TTM Squeeze watchlist as indicated in your video but the horizontal red and green dots showing up as one thick continuous line.
Any idea what went wrong in my setup?
“…horizontal red line…”. Yep, something is definitely wrong. Because this code is designed for a custom column in a watchlist. You tried to put this on a chart?
Watchlist TTM Squeeze judt shows loading
That’s going to happen from time to time and there is nothing you can do about it. The issue is on the servers that run Thinkorswim. We (the users of the platform) have no control over that.
I figured it out. The symbol watchlist scripts don’t work on the TOS simulated trading platform, but they do work on the TOS live trading platform.
Good Day Pete,
I am trying to create a scan that will display multiple stocks and their TTM squeeze dot status on one screen, bottom area. For example, I want to watch for when Stock1, Stock2, and Stock3 are in a squeeze. I would like it displayed on the chart instead of a watchlist. This way, one chart shows this indicator for those selections.
Thanks TONS!
Rose
Thanks for the feedback Rose. You can submit a custom project request for this. Be sure to check our rates and terms on this page. Fill out the contact form at the bottom if you want to submit this as a custom project request: https://www.hahn-tech.com/about/
Thanks for the video. Looking to change time frame – on Custom Quote Formula. I see how to change to a standard Time Frame (daily, 1 minute, 5 minute, etc.). In Time Frame setup I have established my favorite time frames – such as 195 minutes. What would I need to change in your setup to be able to use a column in the watchlist for the squeeze on a 195 minute frame. Thanks. Todd
Only standard time frames are supported for custom watchlist columns.
Thanks for the response Pete.
The green dots show totals of number of occurrences, the red dots do not…can this be fixed?
“Fixed”? Nothing is broken, that is the intention. According to John Carter the number of red dots do not matter. Therefore the code does not count them. You are welcome to post a request in the Q&A forum asking for a modification. Be sure to search the forum first to make sure someone has not already requested this.
Hello Hahn. Is there a code that will also add the TTM wave color and TTM trend indicator colors to my watchlist? If the TTM wave is positive the color would reflect as blue if negative red. If the TTM trend is positive the color would reflect as blue and if negative red.
Search our Q&A forum. Pretty sure we’ve covered these items there.
Thanks for all of the great content Pete. I have my watchlist setup with D_Sqz and W_Sqz but having trouble finding the coding for the daily and weekly direction change. Where can I find the direction color code?
By “direction change” do you mean the watchlist that changes color to match the colors of the histogram of the TTM Squeeze? Did you check the green menu on the left sidebar at the top of this very page?
Thanks for this. This is very helpful. Is it possible to make one for TTM Trend also? Would love to have one for the Squeeze and the trend. Thanks
Search our Watchlist topic in the Q&A forum for the term “trend”. Second item in the results list: https://www.hahn-tech.com/ans/cat/watchlists/?question_type=all&search=trend
Thanks. Got it up and running. This makes everything much easier
Peter, instead of using TTM Trend what if I wanted to use ma’s instead? It would work the same as the TTM trend in regards to color and everything but would use the MA Cross. It would also show how many bars back it crossed like the TTM Squeeze. For ex., 21 MA ( Simple, Exponential) crosses above the 50 MA it would be colored green for an uptrend and colored red when 21 is below the 50. Hope this makes sense. Not even sure where to begin with this. Thanks
I have already made one of these for a client who paid for it as a custom project. Sorry but I cannot make this public, out of respect for the client who paid for it.
Thanks Peter. Is it for sale and how much?
Please submit a custom project request by filling out the contact form at the bottom of this web page. We can discuss the details via email. Thanks! https://www.hahn-tech.com/about/
Great, just did it. Thanks