Custom Watchlist Columns Colored to Match Dots on TTM Squeeze Centerline
Thinkorswim Watchlist TTM Squeeze
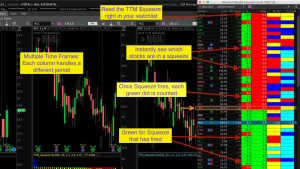
This video shows how to add a column to any watchlist displaying red or green to show you which stocks are in a squeeze. Additionally, this code will count the number of green dots since the last squeeze ended. Zeros mean the stock is in a squeeze. Values greater than zero indicate a stock that has exited the squeeze and is potentially ready for a big move. You can sort the watchlist by this column so you can spot the stocks that have just recently exited the squeeze.
Be sure to watch the video so you understand how to install it. This indicator compliments a previous video we published that displays the colors of the TTM Squeeze histogram in a watchlist. Use these together to create a ‘radar screen’ similar to those used in TradeStation. In a single glance you can see stocks that are ready to make a move and which direction the indicator is predicting.
John Carter’s TTM Squeeze is a licensed study available free on the Thinkorswim platform. This code does not expose any source code as it is fully protected by the Thinkorswim platform.
Learn More:
Click and drag interface to build custom watchlist columns. No code experience required:
Thinkorswim Condition Wizard Watchlist
DISCLAIMER: I AM NOT A CERTIFIED FINANCIAL ADVISOR AND NOTHING IN THIS VIDEO OR TEXT IS AN ADVERTISEMENT OR RECOMMENDATION TO BUY OR SELL ANY FINANCIAL INSTRUMENT. NOR IS THIS VIDEO OR TEXT INTENDED TO INSTRUCT YOU ON HOW TO MAKE BUY OR SELL DECISIONS USING ANY OF THESE INDICATORS.
*Thinkorswim is a chart analysis platform offered by Charles Schwab: https://www.schwab.com/
Charles Schwab provides financial services including the trading of Stocks, Futures, Options and Forex.
Please be sure to share this page with your friends and colleagues. Leaving comments below is the best way to help make the content of this site even better.
Watch the video, Thinkorswim Watchlist TTM Squeeze below:
input price = CLOSE;
input length = 20;
input nK = 1.5;
input nBB = 2.0;
input alertLine = 1.0;
def squeezeDots = TTM_Squeeze(price, length, nK, nBB, alertLine).SqueezeAlert;
def alertCount = if squeezeDots[1] == 0 and squeezeDots == 1 then 1 else if squeezeDots == 1 then alertCount[1] + 1 else 0;
plot data = alertCount;
data.AssignValueColor(if alertCount > 0 then Color.BLACK else Color.WHITE);
AssignBackgroundColor(if alertCount == 0 then Color.RED else Color.GREEN);
Is it possible to create a scan for when ADX is at the top of the range with DMI- and the existing stoch/macd scan? I like to find the lowest price action and ADX is at the top, DMI- is with it and then we get the stoch/macd ‘spike’ and the price moves up. Is it possible to combine that into one scan?
Sounds like it’s possible. You will need to post this in the Q&A forum and provide a screenshot showing at least one of these signals you want the scan to pickup. Make sure the screenshot shows the entire chart so we can replicate it our platform. The title of the question should be 6-8 words and clearly describe the context of your request. Avoid meaningless phrases in the title such as “How to”. The question title should be very similar to what you would used to search for this solution. Have you searched yet?
Pete, thanks for the scans I did weekly and daily but I would like to do 4 hour and 1 hour but it doesn’t come out right. Is there something I ned to change? Thanks for all your help!
This will most likely address the issue: https://www.hahn-tech.com/ans/hourly-adx-watchlist-not-matching-hourly-chart/
getting a lot of NAN black box on squeeze watchlist. is there a reason for this?
As I said. I just tested this on my end and it’s working fine. The problem must be on your platform.
I really like your watchlist that tracks the Squeeze. Is there a way to count the length of the Squeeze(Reds). Knowing how long the Squeeze has been is important to me.
Check this post in our Q&A forum. This is for a scan but the code is quickly adapted to a watchlist. Just compare the code from this video with the code in this post. https://www.hahn-tech.com/ans/ttm-squeeze-scan-that-looks-the-number-of-red-dots-in-a-row/
Hi. I have created the watchlist for the Daily and Weekly. But all they show are red and green…….no light blue, dark blue or yellow. Can you tell me if there’s addition code that needs added for those?
There are two videos. This one does the red and green dots of the TTM Squeeze. The other video does the changing colors of the histogram: https://www.hahn-tech.com/thinkorswim-ttm-squeeze-watchlist/
This was explained in the video.
Thank you so much!!
Hello, great video! I’m having an issue though, I copied the code but the watch list just says “loading”. Can you please tell me what I did wrong?
There may not be anything wrong. Could be many temporary causes for this. Check it again during market hours on Monday and see if it begins to work.
Thank you
TTM squeeze dots, it is showing only for green dots and number of green dots. For red dots, it is not showing number or red dots (always shows zero). Please post this if it requires programming change?
You are correct. This was explained in the video. The number of red dots do not matter, according to the author of TTM Squeeze John Carter.
thank you for quick reply. I would like to see number of red dots also, like number of green dots in TTM squeeze, please post what changes are required in the programming code.
Thank you
There are many posts on this topic in our Q&A forum. I encourage you to browse through there to see what has already been requested and resolved. I believe you can adapt this code to display the count of red dots in a watchlist: https://www.hahn-tech.com/ans/ttm-squeeze-scan-that-looks-the-number-of-red-dots-in-a-row/
Hi Pete, On the TTM squeeze I wanted to setup a trigger (Plot) on the COLOR of the BAR. For Example if the COLOR is LIGHT BLUE or YELLOW then setup an alert. I see you did something similar in the video above. I am planning to use the color of the bar along with the MACD and stochastic indicator. I wrote the initial lines of code, but I am not sure how to get to the Yellow Bars.
Thanks
Hilario
————————————————–
input price = CLOSE;
input length = 20;
input nK = 1.5;
input nBB = 2.0;
input alertLine = 1.0;
def yellowbar = TTM_Squeeze(price, length, nK, nBB, alertLine).SqueezeAlert;
Hi Hilario, Thanks for posting this question. I have moved this over to the Thinkorswim forum, in the Watch List category. You can view the question and answer at this link: https://www.hahn-tech.com/ans/alert-on-color-change-of-ttm-squeeze-histogram/
Hi, I was wondering if this script would work with different settings? I am trying to set the alert line at 1.5 but it does not align with the indicator in ToS. is there anything else in the script that needs to change?