Intraday Alerts At Overnight Highs and Lows
A quick Google search on the term “Overnight Range Trading Setups” nets some very interesting 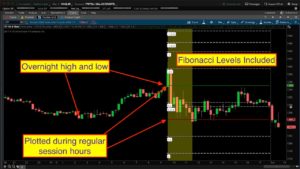 results. So I spent some time writing code and looking at charts. I think there is some real evidence to support the inclusion of the overnight range in your trading setups. I’m not here to show you how to trade the overnight range. However I did build you the best tool I can dream up, given my current knowledge and experience. The rest is up to you.
In this video named Thinkorswim Overnight Range Scan Alert, we show you many examples of how this tool may be applied. In addition to some special levels, we also include the ability to build custom scans based on its signals. As if that wasn’t enough, we throw in a bonus by showing how you can generate real time alerts based on the scan results. I am really excited to be able to present this material. I think this may end up being a valuable tool for many. It was a real eye-opener for me.
The code for the scan is included at the very bottom of this post. So be sure when you are done watching the video to scroll down past the video to get to that code. In the video we show you how to use that code to build your own custom scans, with alerts!
Link to study file: Chart_OvernightRangeSTUDY.ts
Lean More:
Would you like to learn how to master the chart settings on Thinkorswim? Click here for our 3 part series: Thinkorswim Chart Settings Tutorial
*Thinkorswim is a chart analysis platform offered by TD Ameritrade: www.tdameritrade.com
TD Ameritrade provides financial services including the trading of Stocks, Futures, Options and Forex.
Please be sure to share this page with your friends and colleagues. Leaving comments below is the best way to help make the content of this site even better.
Watch the video, Thinkorswim Overnight Range Scan Alert below:
input alertPeriodStart = 730;
input alertPeriodEnd = 930;
input minimumRange = 10;
input alertOnBreak = yes;
input alertOnPullBack = yes;
input numberOfDays = 0;
input numberOfYears = 0;
def okToPlot = GetLastDay() - numberOfDays <= GetDay() and GetLastYear() - numberOfYears <= GetYear() ;
def startCounter = SecondsFromTime(alertPeriodStart);
def endCounter = SecondsTillTime(alertPeriodEnd);
def alertPeriod = if startCounter >= 0 and endCounter >= 0 then 1 else 0;
def regularSessionHours = RegularTradingStart(GetYYYYMMDD()) <= GetTime();
def extendedSessionHours = RegularTradingStart(GetYYYYMMDD()) >= GetTime();
def extendedSessionStart = regularSessionHours[1] and extendedSessionHours;
def regularSessionStart = extendedSessionHours[1] and regularSessionHours;
def extendedSessionHigh = CompoundValue(1, if extendedSessionStart then high else if extendedSessionHours then Max(high, extendedSessionHigh[1]) else extendedSessionHigh[1], 0);
def extendedSessionLow = CompoundValue(1, if extendedSessionStart then low else if extendedSessionHours then Min(low, extendedSessionLow[1]) else extendedSessionLow[1], 0);
def regularSessionHigh = CompoundValue(1, if regularSessionStart then high else if regularSessionHours then Max(high, regularSessionHigh[1]) else regularSessionHigh[1], 0);
def regularSessionLow = CompoundValue(1, if regularSessionStart then low else if regularSessionHours then Min(low, regularSessionLow[1]) else regularSessionLow[1], 0);
def overnightHigh = if okToPlot and regularSessionHours then extendedSessionHigh else Double.NaN;
def overnightLow = if okToPlot and regularSessionHours then extendedSessionLow else Double.NaN;
def breakOfHigh = extendedSessionHigh[1] > regularSessionHigh[1] and regularSessionHigh > extendedSessionHigh;
def breakOfLow = extendedSessionLow[1] < regularSessionLow[1] and regularSessionLow < extendedSessionLow;
def pullbackToHigh = low[1] > extendedSessionHigh[1] and low < extendedSessionHigh;
def pullbackToLow = high[1] < extendedSessionLow[1] and high > extendedSessionLow;
def overnightRange = overnightHigh - overnightLow;
plot scan = if alertPeriod and overnightRange >= minimumRange * TickSize() then breakOfHigh or breakOfLow else no;
#plot scan = if alertPeriod and overnightRange >= minimumRange * TickSize() then pullbackToHigh or pullbackToLow else no;
Hi Pete
1. Is there a way of reducing or customizing the alert msg in the message center? This is the message displayed currently.
“CHART ALERT
2 d 10m chart for ROKU
Chart_OvernightRange (930, 1555, yes, no, 0, 0, no, no, -1.618, no, -1.272, no, -1.0, no, -0.5, no, 0.5, no, 0.618, no, 1.5, no, 2.0, no, 2.272, no, 2.618)
Ring”,12:11:36″
Would be nice to just have something simple message without all the study settings, eg. ROKU – Break Above High
2. How do you get the alerts to pop up as text alerts on the top left? I’m running the study on a chart, not via a scan and only get an audible alert and an entry in the message center.
3. How do you enable the study to show previous days plots like you did in the video? I tried playing with the Number of Days and Number of Years fields but nothing changed. What are these fields used for?
Thanks
JD
1. There is no way to remove those elements from the alert.
2. All the settings for alerts and notifications are adjusted through: Setup –>>Applications Settings –>> Notifications
3. That was explained in the video. I don’t have any more information that was already explained in the video.
Hi Pete, can this study be converted to the previous day range with Fib levels? I use this overnight range for futures trading and it works great with the fib levels. I use the previous day range for most stocks that doesn’t have much movement. I am willing to pay for your service or I’ll donate.
That is absolutely a service we offer. Full details here: https://www.hahn-tech.com/about/
Pete, for the Overnight Range Scan we have to adjust the input alertPeriodStart = 730 and input alertPeriodEnd = 930 to match the time we have on the chart study correct? I have the chart study alert period start set to 930 and alert period end set to 1500. Today, I got 1 email on a pull back to high but looking at the chart there 2 other times when there was a pull back to high which I did not receive email. I have screenshots the chart and of the scan settings.
As I explained in the video, the scans will ALWAYS use Eastern time regardless of what you set your charts to. So it’s best to just set your charts to Eastern time zone so they will always be aligned with scan results.
Pete, I do have the chart settings set to New York time zone. There shouldn’t be any issues with me adding stock filters to the scan like $1-$12 and volume min 100000. I am also scanning in All Nasdaq stocks but only get a handful of alerts. Is there a way to run a scan of today’s trading session to see if alerts were not sent?
What time frame did you use for the scan?
The few emails I received today were based on 1min scan
I was expecting that. The Thinkorswim platform does not have the resources to run scans at 1 min time frames. I suggest you start at 15 min and work your way down until it fails.
Thanks Pete, I have tried 3 and 5 mins too with a few results but I will start at 15 and work down as you suggest. I enjoy reviewing the site for new trading ideas.
Pete, I have been using the Overnight Range scan and I really like it. Can the above code be modified to also alert on break of one of the fibs that is turned on through Edit studies? I saw something similar on the site here: https://www.hahn-tech.com/ans/how-to-add-chart-based-study-alert-fib-retracement/ Can the code on that alert be modified to run as a scan instead of an alert using the same 78.6 fib level?
Thank you,
Carlos
The Overnight Range scan does not include the Fib levels. So this would require a considerable amount of modification. The code posted in the Q&A forum that you linked to can be modified to run as a scan. But the modifications are also quite a chore to accomplish.
Thank you Pete for the quick reply, I will play with the alert code from link I found.
Terribly sorry to put you through all that. I was not aware that YouTube has completely removed all annotations. Even from videos previously published. Please contact me via this contact form and I will email you the link.
https://www.hahn-tech.com/about/
I will have to update my entire library of videos to correct the issue for the rest of the viewers:
The happens when your web browser is blocking Annotations on YouTube. You can try using a different web browser or try resetting it to default settings.
I used IE, Chrome and Firefox, but there is no download link. I have downloaded URL to your study files in other videos before, but not this one.
In this video, you actually added a message in the top right corner for the link to the study file, but that one does not go to the file either. thanks
I’m still trying to work the bugs out for that embedded link. Just follow my previous instructions to contact me via web page I link in previous comment.
Hi D4S looks like there is a syntax error in def okToPlot, can you please check?
Hi, Is there a version of this for after hours range i.e 4pm EST to 8pm EST? thanks
No, there is not. Sorry.
Ok. I modified this code to include prev days after-hours sessions price action as well. Below is the code if anyone would like to use it. Note that its a simpler version that just plots the AH/PM high/low (without any of the alerts) created to suit my needs.
#set how many days to plot after-hours/pre-market (AH/PM) highs/lows
def numberOfDays = 0;
def numberOfYears = 0;
def okToPlot = GetLastDay() – numberOfDays <= GetDay() and GetLastYear() – numberOfYears = RegularTradingStart(GetYYYYMMDD())) and (GetTime() = RegularTradingEnd(GetYYYYMMDD());
def premarketSessionHours = GetTime() <= RegularTradingStart(GetYYYYMMDD());
def extendedSessionHours = postcloseSessionHours or premarketSessionHours;
#set flags for AH and regular session starts
def postcloseSessionStart = regularSessionHours[1] and postcloseSessionHours;
def regularSessionStart = regularSessionHours and premarketSessionHours[1];
#update/retain extended hours (AH and PM) highs/lows
def extendedSessionHigh = CompoundValue(1, if postcloseSessionStart then high else if extendedSessionHours then Max(high, extendedSessionHigh[1]) else extendedSessionHigh[1], 0);
def extendedSessionLow = CompoundValue(1, if postcloseSessionStart then low else if extendedSessionHours then Min(low, extendedSessionLow[1]) else extendedSessionLow[1], 0);
#Plot prev days AH and current days PM high/low during current days regular session hours
plot overnightHigh = if (okToPlot and regularSessionHours) then extendedSessionHigh else Double.NaN;
overnightHigh.SetDefaultColor(Color.DARK_GREEN);
overnightHigh.SetStyle(Curve.MEDIUM_DASH);
overnightHigh.SetLineWeight(1);
plot overnightLow = if (okToPlot and regularSessionHours) then extendedSessionLow else Double.NaN;
overnightLow.SetDefaultColor(Color.DARK_RED);
overnightLow.SetStyle(Curve.MEDIUM_DASH);
overnightLow.SetLineWeight(1);
Um… the original code already covered both after market and before market hours. That’s called Extended Hours session. The code includes all of it. From your previous comment I thought you were asking to have to code only cover the after market hours.
Earlier response ended up without a few lines of code. Perhaps its the auto format during posting at work here?
Hmm.. it only showed the pre-market session high/low for me and did not include the prior days after hours high/low. May be I used a different version of the code.
There is limited space here as you can see. Not the best place to be trying to work out changes to some code. Please post a request in the Q&A forum if you still need assistance. Make to include a link to the video and a screenshot so we can setup our charts to match yours and figure out what’s up.
Hello,
I copied the code above and created the study in TOS. I set the time for 930 1030. It appears quite different that what the video describes. There are only a few settings available – no fibs etc. I can send a screenshot if you would care to check it out. Thank you
It looks very interesting
First question I have is, what time zone do you have your charts set to? The start and end time you list would be compatible only with the Eastern Timezone. The other item to check is to make sure you are plotting extended session in addition to regular session.
Pete, Thanks for your reply
My charts are set up for EDT: Last bar on 5 m chart is 15:10
I have the time on the study set 9:30 10:30
Here is a share link on what I have http://tos.mx/PELq4o
Ok, this is a chart setting causing the issue. Go to chart settings. Select the Price Axis tab. Uncheck the box named: “Fit Studies”
The other problem is you are using the scan version of the code in a chart study. You need to use the Chart study version of the code.
Pete, That fixed the display issue. I would never have figured that out!
I changed to a QQQ chart with extended hours displayed. the chart is good but no other data is on the chart. the settings in the study control box 920 1030 10 YES YEs 30 0.
Plots: scan – Show Plot checked
Again, charts are set for EDT
Thoughts?
You seem to have missed my last reply in which I explained that you are using the scan version of this code as a chart study. That will never work. The scan code is meant for the scan. You need to get the Chart Study version. Link provided within the video.
Pete, Thanks so much for your patience.
I now have both the study and scan installed. I do a lot of scans so that is no issue.
I will start Playing with the study and see how it goes.
Will give feedback in a day or two next week.
Frank