Custom Scan Based on Ichimoku
Thinkorswim Scan Ichimoku
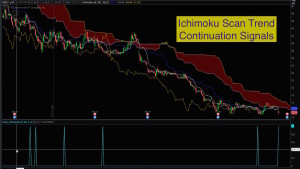
Free custom code linked below. Based on the Ichimoku study, this code will let you scan for Cloud Breakouts as well as Trend Continuation signals. The signals are crafted to mirror the techniques taught by Hubert Senters (videos linked below). It will scan for longs or shorts. Each scan signal has two versions. One captures the raw signal and the second adds a filter using the Chikou (Lagging Line) to confirm the bullish or bearish direction. This provides a total of 8 different signals you can use for scans.
Here is a link to the custom code for running the scans in Thinkorswim:
Here is the link to video instruction by Hubert Senters:
Ichimoku Trading Strategies For Finding Better Trades by Hubert Senters
Lean More:
Would you like to learn how to master the custom scan tools on Thinkorswim?
Click here: Thinkorswim Scans Beginner to Advanced
Learn how to build custom scans without writing any code: Thinkorswim Condition Wizard
DISCLAIMER: I AM NOT A CERTIFIED FINANCIAL ADVISOR AND NOTHING IN THIS VIDEO OR TEXT IS AN ADVERTISEMENT OR RECOMMENDATION TO BUY OR SELL ANY FINANCIAL INSTRUMENT. NOR IS THIS VIDEO OR TEXT INTENDED TO INSTRUCT YOU ON HOW TO MAKE BUY OR SELL DECISIONS USING ANY OF THESE INDICATORS.
*Thinkorswim is a chart analysis platform offered by TD Ameritrade: www.tdameritrade.com
TD Ameritrade provides financial services including the trading of Stocks, Futures, Options and Forex.
Please be sure to share this page with your friends and colleagues. Leaving comments below is the best way to help make the content of this site even better.
thanks definately some awsome material, but i think line 73 signal bearish confirmation has stopped working
Thanks for the feedback. I just check the signal at line 73 and it is working just fine. I Found signals on AAPL and AMZN over the period of the last year. This pattern is pretty rare so I would not expect it to find valid signals every day. Just add this scan to your chart and plot is as a lower study and you can see where each of the signals appear on historical section of the charts.
Hi Pete, I wanted to let you know that I really enjoyed your Ichimoku training today. I have been studying Ichimoku for the past 2 months and wanted to see what you had to say.
I ran the scan with the “plot scan = signalBreakAboveCloud and signalBullishConfirmation;” uncommented, which displayed 17 stocks to look at. I charted the ‘FNGR’ stock which rose +82% today and was presented with the most dramatic view of the ‘BreakAboveCloud’ with ‘BullishConfirmation’ I have ever seen. I wish I could attach the screen shot for you but it doesn’t look like this window can do that – Anyway, this scan has presented me with trading opportunities that I wouldn’t have known how to look for prior to tonight. Awesome Job!
Thanks So Much
Regards
Brian Thomas
Love to get feedback like this. Thanks for taking the time. If you found this video helpful, your research will be boosted by using the chart strategy based on the same signals included in the scan. This allows you to back-test specific setups and exits to find a optimal setups: https://www.hahn-tech.com/thinkorswim-strategy-ichimoku/
Not getting the lagging line binary signal in the sub-chart information box. Double checked that I selected a correct plot scan within Scan_Ichimoku in thinkscript editor “w/confirmation”. For example, looking at ALK (Alaska Air), daily chart with clear examples of: plot scan = signalBreakBelowCloud and signalBearishConfirmation;
however, I get only a “blue 1” in the sub-chart information box while expecting to see both the blue and red 1s. Not a big problem, but I am curious. Thank you.
If you have only enabled one scan signal, as you described. Then you would only expect to see a single blue line on the lower subgraph. The way the scan is configured. You can only display one scan signal at a time. You cannot display more than one.
If there is a cloud break and confirmation signal, should I not see a blue 1 and pink 1 in the lower sub-chart info box?
Only one line can be plotted using the scan. The scan was never designed to show more than one line. The scan is for running scans. Placing it on the lower subgraph is simply used to see what the scan sees. If you are trying to plot signals on the chart I suggest you apply the chart study supplied with following video: https://www.hahn-tech.com/thinkorswim-alert-ichimoku/ That video provides a chart study which will display all of the available signals.
Refer to above video at mark 10:17
Yes, but did you complete the modifications I demonstrated at the 9:12 mark?
Hi, I can’t download the code on my Mac. I’m not sure why but it also won’t display a preview. Is there anywhere else I can get the code? thanks
The answer to your question is found in our FAQ section, which you can access at any time via the Help menu at the top of our website. Search the FAQ section for the term “download” and you will find the following solution among those results: https://www.hahn-tech.com/ans/how-to-download-and-import-study-ts-files-into-thinkorswim/
Thank you very much Pete. I found it not to long after typing the question by reading the further comments, and got it uploaded to TOS. I have a lot to learn when it comes to setting up and using TOS as I just downloaded the app yesterday. By the way, your videos are top notch, Im going through a few of them now on youtube and will be back when I have a better understanding of how to actually use all of the features as I know the power of the Ichimoku and have been manually scanning using this strategy with great results. Now I can’t wait to be able to implement the use of a scanner to help streamline the process and capitalize on trades I would normally miss, but later saw they fit all my criteria before nice breakouts or legs down. Also I love that you have a donation option…Im sending a donation now and I doubt it will be the last. Once I get to the level of understanding where I don’t have to ask simple, easily found questions ill be back to pick your brain and hopefully unlock the power of a few of these scanners. Thanks again!
I’m glad you were able to get it working by viewing other comments on this page. I appreciate your voluntary contribution. We do not call that a “donation” because Hahn-Tech, LLC is a for-profit company. Consider the Voluntary Contribution similar to a tip jar at your local coffee shop. Thanks for taking the time to express your feedback about the content we provide on our website.
WoW, missed that. Plain as day when it is pointed out. I need to study your videos closer. Thank you so much for your patience and willingness to share.
Glad I was able to help. Take care.
How do I write it for when Price closes above or below the Kijun line only(I dont want to plot the Tenkan line)
If you want a scan that is based solely on price “crossing” above or below the Kijun line you can build that in just a few clicks of your mouse once you learn how to use the Condition Wizard: https://www.hahn-tech.com/thinkorswim-condition-wizard/
First of all, this is awesome. May I ask, how do I set up the scan for the “lagging line” crossing below the cloud or above the cloud and nothing else? Thank you
I suggest you spend some time searching and browsing existing solutions in the Q&A Forum: https://www.hahn-tech.com/ans/cat/scans/?question_type=all&search=ichimoku
Hello Pete, Thanks for all your work.
Please, is it possible to use the scan as a watchlist quote item and have background color to indicate which stocks have the triggers? I tried it, it shows “1” when there is a trigger, which is great but a way to stand out may help especially looking through old watchlist. This will be similar to what you have for ADX scans. Any help will be greatly appreciate.
A quick search of the Q&A Forum reveals many examples already posted. Here are the search results from the “Watch List” topic of our forum. The search term used was “ichimoku”: https://www.hahn-tech.com/ans/cat/watchlists/?question_type=all&search=ichimoku
You should also check out the video I published on using the Condition Wizard to build custom watchlist columns. You will find an example in this video of how to modify the code to generate the color change based on a specific condition: https://www.hahn-tech.com/ans/cat/watchlists/?question_type=all&search=ichimoku
I’m having trouble downloading the code and converting in cloudconvert. Any help would be much appreciated.
Check my answer to the same question posted by Jantsen Harrington date June 8th just a few comments below.