Custom Scan Using a Corrected Relative Strength Study
Thinkorswim Scan Relative Strength
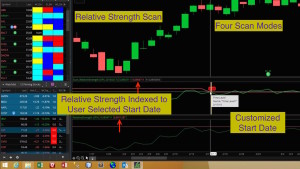
Quickly find stocks that over-perform or under-perform an index. This video shows how to configure a custom scan in Thinkorswim using an improved Relative Strength study. Use recent market turning points as your start date. The scan will compare stock performance from that date forward. Easily find stocks that are trending stronger or weaker than the index. Catch stocks as they make their first transition from under-perform to over-perform. Find out where the big money is reallocating their holdings.
Markets go through cycles, and during transitions the old leaders are replaced by new ones. This scan will help you spot those stocks which are in the process of that transition. Free custom code is included. The clickable link is embedded directly in the video. Be sure to not to miss it.
Link to study file: Scan_RelativeStrengthSTUDY.ts
Lean More:
Would you like to learn how to master the custom scan tools on Thinkorswim?
Click here: Thinkorswim Scans Beginner to Advanced
Learn how to build custom scans without writing any code: Thinkorswim Condition Wizard
DISCLAIMER: I AM NOT A CERTIFIED FINANCIAL ADVISOR AND NOTHING IN THIS VIDEO OR TEXT IS AN ADVERTISEMENT OR RECOMMENDATION TO BUY OR SELL ANY FINANCIAL INSTRUMENT. NOR IS THIS VIDEO OR TEXT INTENDED TO INSTRUCT YOU ON HOW TO MAKE BUY OR SELL DECISIONS USING ANY OF THESE INDICATORS.
*Thinkorswim is a chart analysis platform offered by Charles Schwab: https://www.schwab.com/
Charles Schwab provides financial services including the trading of Stocks, Futures, Options and Forex.
Please be sure to share this page with your friends and colleagues. Leaving comments below is the best way to help make the content of this site even better.
Here is the code used to create your own custom watchlist columns as demonstrated in the video below.
Hello Pete,
I cant believe just today I learnt about your great website! Congratulations!
I tried to use paste the SCAN RELATIVE STRENGHT code in the thinkScript editor and the message I receive is:
“Exactly one plot expected”
Are you aware of what can be causing this issue?
Thank you and regards,
Andrea
Make sure you did not skip any portions of the video. The code was designed as a chart study and in the video I explain the changes required to make it work as a scan.
Thank you very much and sorry if the excitement of the discovery made me jump one whole step! 🙂
Hi Pete,
is it possible to change the timeCondition in AddChartBubble ( boolean time condition, double price location, Any text, CustomColor color, boolean up); to take a range, to have referenceStartDate and referenceEndDate? and if so, how can i accomplish that.
Thank you.
Kristina
Well beyond the scope of what we can address in the comment section of a video. Please check the Q&A forum to see if your question has already been solved and if not then post this as a new question.
Thank you Pete. It was exactly what I was looking for. Cheers!
Hi Pete, I’ve been wanting to tinker with this one for awhile. Today I have successfully created scans that are synchronized with the studies on my charts. I am wondering if you have created watchlist columns along the way? It would be great to have a “rsi crossover” colored box and a “stronger than” colored box next to the symbols in my watchlist. Let me know please and if you have not created them but could build them for me that would be great! Doug
P.S. Just want you to know… I did attempt to massage the script for a column but honestly I’m pretty miserable at this thus reaching out to you.
Sure thing. Just post it in the Q&A forum. Be sure to include a link to the video so other viewers won’t be lost. We have a section set aside for Watchists: https://www.hahn-tech.com/ans/cat/watchlists/
I am Having trouble withthe Relative Strength Scanner. When I tried to access the Scan_realtive strength Study.tx I cannot get it to open.
I have copied the code from the video but it is not working?? any advise
Rich
rich.huber01@gmail.com
The file cannot be opened. This post in our FAQ’s should help: https://www.hahn-tech.com/ans/how-to-download-and-import-study-ts-files-into-thinkorswim/
For some reason, I can’t get this scan to work. I’ve tried everything I can think of. I’ve compared the code that I’ve got to what you are showing in the video. I can’t see any differences. I’ve tried different dates and indexes, and I always get “No Matching Symbols”. I don’t want to post the code to the scan on here, because I know you want it in the video so people will watch the video and learn to use it correctly. Do you have any thoughts on what I could be doing wrong – or can I send my scan code to you and have you glance over it?
What are you using for CorrelationWithSecurity? What are you using for referenceDate input? What time frame are you using?
CorrelationWithSecurity is SPX – and I’m intersecting with S&P 500 (I’ve also tried the nasdaq and russel 2000 like you did on your video)
referenceDate is currently set at 20180128 (but I’ve tried several other dates as well)
The time frame that I’m using is “Day”
First thought is your date. The date must be a day the markets were open for trade. Did I not mention that in the video? The date you have selected is a Sunday. Change to the 26th and see if that corrects the issue.
You probably did mention that in your video, and I just missed it. Changing the date to 20180126 did not make a difference though.
I see that. There something wrong with the scan engine. It is literally broken. Try “plot scan = close > 0;” and you get zero results. This happens from time to time. I usually report it to Thinkorswim support when I find it has broken like this.
Ok – Thank you! And thanks for the wonderful video!
You are very welcome. I have just submitted a support ticket on this issue. Hope they get it fixed quickly.
Great scan concept…just what I am looking for…but it appears that the code is still broken from TOS like so much of the platform….have you updated the thinkscript recently…thank you
“appears that the code is still broken”…. “like so much of the platform”??? I have no clue what you are talking about. If you provide details perhaps I can clear things up. Nothing broken in this code. Post in the Q&A forum if you need assistance. Search first to see if your question has already been addressed.
In the scan, make sure you’re searching stocks and not options. I believe TOS defaults to options.
can you make me a custom scan?
Sure thing. You can get all the details about how to submit your custom project request here: https://www.hahn-tech.com/about/
Hi Pete, great work as always! The code for the relative strength scan does not appear to be posted on this page. Can you please upload the code? Thanks!
Instructions are given within the video description: “Free custom code is included. The clickable link is embedded directly in the video. Be sure to not to miss it.”
The vast majority of our free indicators are provided in this manner. Very rarely will you find code posted directly on the web page.