This premium indicator has been upgraded. You can view the current version of this indicator on the following webpage:
https://www.hahn-tech.com/thinkorswim-volume-profile-v4/
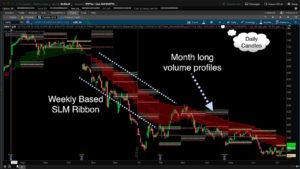
This is an upgraded version of the very popular Volume Profile study. This version includes a momentum study from a higher time frame that can be used to filter long and short signals. This indicator projects the volume profile area into the current trading period. Fully adjustable to fit whatever time frame you are trading. Trigger zones are included, which are fully adjustable. Setups occurring within the shaded trigger zones are accompanied by visual and audible alerts.
- Indicator Type: Support and Resistance
- Indicator Basis: Volume-At-Price AKA: Market Profile
- Time Frames: All time based aggregation periods
- Trade Setups:
- Scalping
- Reversals
- Fading key levels
UPDATE: 7/13/16 Version Two Released
Just click on this link and fill out the contact form at the bottom of the page. We will coordinate payment and delivery of the final code.
Thinkorswim Premium Trading Tools
DISCLAIMER: I AM NOT A CERTIFIED FINANCIAL ADVISOR AND NOTHING IN THIS VIDEO OR TEXT IS AN ADVERTISEMENT OR RECOMMENDATION TO BUY OR SELL ANY FINANCIAL INSTRUMENT. NOR IS THIS VIDEO OR TEXT INTENDED TO INSTRUCT YOU ON HOW TO MAKE BUY OR SELL DECISIONS USING ANY OF THESE INDICATORS.
*Thinkorswim is a chart analysis platform offered by TD Ameritrade: www.tdameritrade.com
Charles Schwab provides financial services including the trading of Stocks, Futures, Options and Forex.
Please be sure to share this page with your friends and colleagues. Leaving comments below is the best way to help make the content of this site even better.
Pete, On the TOS volume profile, either yours or TOS standard, is there a way you can modify the code to select when the volume profile starts by date or dynamically by what the chart window is expanded to? Right now the only choices are the chart period setting or week, op exp, etc. Ideally I would like to be able to see all the volume profile information starting from key inflections dates like SPY 3/23/2020, etc.
regards,
Rob
Using the default settings for the built-in version that comes with Thinkorswim the study computes the values based on all of the viewable data on the chart. But there is nothing that would allow you to create the profile for a specific start date and end date. That would require a significant modification to the code, IF it were even possible.
Hi – How quickly are the levels placed on the chart for signals? Is there an aler funchtion.
Thx
Those questions are answered in the demo video. But thanks for asking. Please don’t hesitate to ask any questions that are not already covered in the demo video. For full details you can also view the demo videos we published for the first two versions of this study. Original Version: https://youtu.be/UerGumC2CUA
2nd version: https://youtu.be/aAEetM8oOXo
and
No clues on the “turtle soup” part of your question. You might check the Q&A forum, which is were to search for questions like this. As to the settings for the SLM Ribbon included with the current version of Volume Profile, you get to pick which time frame to apply. Now to the last part of your question. The plots of this premium version are projecting the values from the previous profile period into the current profile period. The original demo video explains this in the greatest detail: https://youtu.be/UerGumC2CUA
Pete – I hope you’re feeling better. I am just wondering if this indicator works with forex because of the TOS issues with reporting volume.
You can test this for your self by trying to plot volume on your Forex chart. If there is no volume it’s impossible to build a volume profile.
Can’t get to version 1 of Volume profile study video. Please send me a link. Thanks in advance……Sid
https://www.hahn-tech.com/thinkorswim-scan-volume-profile/
Do you have any recommendations on setting the fibonacci retracement levels on this indicator? Having trouble finding consistency here. I would love to be able to project the profit taking levels for stocks setting new highs. Many thanks! Kevin
Sorry, that is way above my “pay grade”. If I could find profitable levels to trade using any indicator, this website would never have existed. I just build the tools that traders ask for.
I completely understand, you’re doing an awesome job. Thanks again for all of your hard work. I just came across this code, which was posted by a TOS employee in reply to a similar question some time ago. It doesn’t appear to be fully functional.. have you seen this?
#hint: Fibonacci Retracements\nFibonacci retracements use horizontal lines to indicate areas of support or resistance at the key Fibonacci levels before it continues in the original direction. These levels are created by drawing a trendline between two extreme points and then dividing the vertical distance by the key Fibonacci ratios of: 23.6%, 38.2%, 50%, 61.8%, 78.6%, and 100%.
#hint Price: Price used in the alerts on crossing retracement lines. (Default is Close)
#hint onExpansion: Determines if the retracement lines are projected past the current bar into the right side expansion (Default is Yes)
#hint Extend_to_left: Determines if the retracement lines are extended to the left side of the chart. (Default is No)
#hint Coefficient0: Retracement Line 0: Retracement from the highest high to the lowest low.\n (Default is 0%)
#hint Coefficient_1: Retracement Line 1: Retracement from the highest high to the lowest low.\n (Default is 23.6%)
#hint Coefficient_2: Retracement Line 2: Retracement from the highest high to the lowest low.\n (Default is 38.2%)
#hint Coefficient_3: Retracement Line 3: Retracement from the highest high to the lowest low.\n (Default is 50%)
#hint Coefficient_4: Retracement Line 4: Retracement from the highest high to the lowest low.\n (Default is 61.8%)
#hint Coefficient_5: Retracement Line 5: Retracement from the highest high to the lowest low.\n (Default is 78.6%)
#hint Coefficient_6: Retracement Line 6: Retracement from the highest high to the lowest low.\n (Default is 100%)
#wizard input: Price
#wizard text: Inputs: Price:
#wizard input: onExpansion
#wizard text: onExpansion:
#wizard input: Extend_to_left
#wizard text: Extend_to_left:
#wizard input: Coefficient0
#wizard text: Coefficient0:
#wizard input: Coefficient_1
#wizard text: Coefficient_1:
#wizard input: Coefficient_2
#wizard text: Coefficient_2:
#wizard input: Coefficient_3
#wizard text: Coefficient_3:
#wizard input: Coefficient_4
#wizard text: Coefficient_4:
#wizard input: Coefficient_5
#wizard text: Coefficient_5:
#wizard input: Coefficient_6
#wizard text: Coefficient_6:
input price = close;
input high = high;
input low = low;
input onExpansion = Yes;
input Extend_to_left = no;
input Coefficient0 = 0.000;
input coefficient_1 = .236;
input Coefficient_2 = .382;
input Coefficient_3 = .500;
input Coefficient_4 = .618;
Input Coefficient_5 = .786;
input Coefficient_6 = 1.000;
def a = HighestAll(high);
def b = LowestAll(low);
def barnumber = barNumber();
def c = if high == a then barnumber else double.nan;
def d = if low == b then barnumber else double.nan;
rec highnumber = compoundValue(1, if IsNaN(c) then highnumber[1] else c, c);
def highnumberall = HighestAll(highnumber);
rec lownumber = compoundValue(1, if IsNaN(d) then lownumber[1] else d, d);
def lownumberall = LowestAll(lownumber);
def upward = highnumberall > lownumberall;
def downward = highnumberall < lownumberall;
def x = AbsValue(lownumberall – highnumberall );
def slope = (a – b) / x;
def slopelow = (b – a) / x;
def day = getDay();
def month = getMonth();
def year = getYear();
def lastDay = getLastDay();
def lastmonth = getLastMonth();
def lastyear = getLastYear();
def isToday = if(day == lastDay and month == lastmonth and year == lastyear, 1, 0);
def istodaybarnumber = HighestAll(if isToday then barnumber else double.nan);
def line = b + (slope * (barnumber – lownumber));
def linelow = a + (slopelow * (barnumber – highnumber));
def currentlinelow = if barnumber <= lownumberall then linelow else double.nan;
def currentline = if barnumber = highnumberall and barnumber = lownumberall and barnumber = highnumberall then highestall((b + (range * coefficient0))) else if upward and onexpansion and barnumber >= lownumberall and !extend_to_left then highestall(a – (range * coefficient0)) else if downward and !onexpansion and extend_to_left and barnumber <= istodaybarnumber then highestall((b + (range * coefficient0))) else if upward and extend_to_left and !onexpansion and barnumber = highnumberall and barnumber = lownumberall and barnumber = highnumberall then highestall((b + (range * coefficient_1))) else if upward and onexpansion and barnumber >= lownumberall and !extend_to_left then highestall(a – (range * coefficient_1)) else if downward and !onexpansion and extend_to_left and barnumber <= istodaybarnumber then highestall((b + (range * coefficient_1))) else if upward and extend_to_left and !onexpansion and barnumber = highnumberall and barnumber = lownumberall and barnumber = highnumberall then highestall((b + (range * coefficient_2))) else if upward and onexpansion and barnumber >= lownumberall and !extend_to_left then highestall(a – (range * coefficient_2)) else if downward and !onexpansion and extend_to_left and barnumber <= istodaybarnumber then highestall((b + (range * coefficient_2))) else if upward and extend_to_left and !onexpansion and barnumber = highnumberall and barnumber = lownumberall and barnumber = highnumberall then highestall((b + (range * coefficient_3))) else if upward and onexpansion and barnumber >= lownumberall and !extend_to_left then highestall(a – (range * coefficient_3)) else if downward and !onexpansion and extend_to_left and barnumber <= istodaybarnumber then highestall((b + (range * coefficient_3))) else if upward and extend_to_left and !onexpansion and barnumber = highnumberall and barnumber = lownumberall and barnumber = highnumberall then highestall((b + (range * coefficient_4))) else if upward and onexpansion and barnumber >= lownumberall and !extend_to_left then highestall(a – (range * coefficient_4)) else if downward and !onexpansion and extend_to_left and barnumber <= istodaybarnumber then highestall((b + (range * coefficient_4))) else if upward and extend_to_left and !onexpansion and barnumber = highnumberall and barnumber = lownumberall and barnumber = highnumberall then highestall((b + (range * coefficient_5))) else if upward and onexpansion and barnumber >= lownumberall and !extend_to_left then highestall(a – (range * coefficient_5)) else if downward and !onexpansion and extend_to_left and barnumber <= istodaybarnumber then highestall((b + (range * coefficient_5))) else if upward and extend_to_left and !onexpansion and barnumber = highnumberall and barnumber = lownumberall and barnumber = highnumberall then highestall((b + (range * coefficient_6))) else if upward and onexpansion and barnumber >= lownumberall and !extend_to_left then highestall(a – (range * coefficient_6)) else if downward and !onexpansion and extend_to_left and barnumber <= istodaybarnumber then highestall((b + (range * coefficient_6))) else if upward and extend_to_left and !onexpansion and barnumber <= istodaybarnumber then highestall(a – (range * coefficient_6)) else if downward and onexpansion and extend_to_left then highestall((b + (range * coefficient_6))) else if upward and onexpansion and extend_to_left then highestall(a – (range * coefficient_6)) else double.nan;
Retracement6.assignvaluecolor(color.red);
retracement6.hidebubble();
#AddChartBubble((barnumber == istodaybarnumber+10), retracement6, concat( "$", round(retracement6, 2)), color.red, yes);
AddChartBubble((downward and barnumber == highnumberall), retracement6, concat( (coefficient_6 * 100), "%"), color.red, yes);
AddChartBubble((upward and barnumber == lownumberall), retracement6, concat( (coefficient_6 * 100), "%"), color.red, yes);
alert((price crosses below Retracement0) , "Price crosses below Retracement Line 0");
alert((price crosses above Retracement0) , "Price crosses above Retracement Line 0");
alert((price crosses below Retracement1) , "Price crosses below Retracement Line 1");
alert((price crosses above Retracement1) , "Price crosses above Retracement Line 1");
alert((price crosses below Retracement2) , "Price crosses below Retracement Line 2");
alert((price crosses above Retracement2) , "Price crosses above Retracement Line 2");
alert((price crosses below Retracement3) , "Price crosses below Retracement Line 3");
alert((price crosses above Retracement3) , "Price crosses above Retracement Line 3");
alert((price crosses below Retracement4) , "Price crosses below Retracement Line 4");
alert((price crosses above Retracement4) , "Price crosses above Retracement Line 4");
alert((price crosses below Retracement5) , "Price crosses below Retracement Line 5");
alert((price crosses above Retracement5) , "Price crosses above Retracement Line 5");
alert((price crosses below Retracement6) , "Price crosses below Retracement Line 6");
alert((price crosses above Retracement6) , "Price crosses above Retracement Line 6”);
I placed a TOS BetterVolume Indicator in the forum.
It is important to note that the version for Thinkorswim is not able to match the full functionality of the TradeStation version. That is why, despite numerous requests, I have refused to publish one. The full version of the Better Volume indicator is able to read bid and ask volume from the data stream. Something which is available for TradeStation but is not available for Thinkorswim.
Hi Pete, Is there an indicator for ThinkOrSwim based on the Better Volume Indicator (http://emini-watch.com/free-stuff/volume-indicator/). They have code at the bottom of the page but not for thinkScript. Thanks
Hi Hilario,
I have reviewed this before and each time someone asks I check the Thinkscript language reference to see if they have added the components needed to implement this.
At this time they have still not enabled Thinkscript to read volume at the bid or ask. All volume information is lumped together. So we really can’t fully implement the better volume indicator on Thinkorswim… yet.