Version Two: Intraday Alerts on New Highs and Lows
This is an upgraded version of our daily high/low alert for Thinkorswim. Improvements include the ability to control how many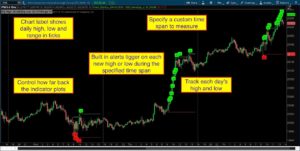 previous days in which the lines and chart bubbles will plot. I have also removed the high low lines from plotting outside the specified time span. Version two utilizes new techniques I have learned while assisting viewers with their own custom projects. Thinkorswim Alert High Low Version Two is intended to be plotted on an intraday chart.
You get to set the start time and end time and the indicator will track the highest high and lowest low throughout that time span. Each new high or new low will trigger an audible and visual alert on your chart. The time span adjustment lets you view a chart including extended hours trade while only tracking the high and low during the regular market hours.
Link to study file: Chart_DlyHiLo_24hrV2bSTUDY.ts
Be sure to view the original video to see this indicator in action and understand how the alerts work.
Lean More:
For those looking for a scan which is based on this solution you will want to examine the following post in our Q&A Forum: https://www.hahn-tech.com/ans/tos-scanner-for-new-high-intraday/
Would you like to learn how to master the chart settings on Thinkorswim? Click here for our 3 part series: Thinkorswim Chart Settings Tutorial
DISCLAIMER: I AM NOT A CERTIFIED FINANCIAL ADVISOR AND NOTHING IN THIS VIDEO OR TEXT IS AN ADVERTISEMENT OR RECOMMENDATION TO BUY OR SELL ANY FINANCIAL INSTRUMENT. NOR IS THIS VIDEO OR TEXT INTENDED TO INSTRUCT YOU ON HOW TO MAKE BUY OR SELL DECISIONS USING ANY OF THESE INDICATORS.
*Thinkorswim is a chart analysis platform offered by Charles Schwab: https://www.schwab.com/
Charles Schwab provides financial services including the trading of Stocks, Futures, Options and Forex.
Please be sure to share this page with your friends and colleagues. Leaving comments below is the best way to help make the content of this site even better.
The is a great tool. Question: Would it be possible for the bubble to display the HOD counts instead of “Hi”? For example, if the intraday chart is currently on its 300th HOD, then the first HOD bubble would read 1 and the last one would read 300. Thanks for all you do!
Sure it’s possible. Far too complex a solution to provide in the comments section of the video.
Pete,
This alert is not working correctly anymore. I have used it in the past but something in TOS must have changed and broken the script. I am looking at today’s (March 18) live daily one minute chart of SPY with version 2b of your script. The green bar for your script (and the grey text box) state the daily high as 254.45, but the daily high bubble says 248.47. The high daily bar appears to be at 9:14 am CST. There is no other bar that touches the green line that the script produces.
I tried to attach a screen shot, but couldn’t figure out how to do that. The daily low from your script seems to be working ok.
What do you think is going wrong?
Thanks,
Brook
I just checked another dozen or so random symbols and the same problem occurs on all of them. I haven’t changed anything in the script, it is a clean download of it from the website.
The most likely cause is that you are not including extended hours data on your chart. Need to have that included or it will not work correctly.
I just checked and it is showing the correct values on my chart. Perhaps you changed a chart setting that is causing it not to work on yours?
Is the extended hours setting the only one that could be affecting it, or are there others? I am would like the script to work for options, is that a problem since they don’t trade in extended hours?
Something in my TOS just doesn’t seem to be right. Is there a button to reset everything to default factory settings?
Removing extended hours data was the only thing I tested and it produced the exact results you reported. So I didn’t look any further. You reset any chart or chart grid to default settings. The location of the menu item will vary depending on which you want to reset and whether you are on Chart Grid layout or Flexible Grid layout.
Hi Pete,
Ok, I reinstalled and made sure extended hours is enabled. Now it seems to be working. The green and red lines on graphs along with the bubbles match now. However, the grey text for the Dly High and Dly Low is using wrong numbers. So I am looking at todays 1m daily chart of OLED. Everything looks ok except for the grey text numbers. That box says the daily high is 107.37, but the green line says 117.36. The daily low number also says 107.37 while the chart red line shows 105.11. Range says 0. I am not sure where the system is looking for that data. I will keep looking.
Thanks,
Brook
Ok, in the case of OLED there is not sufficient extended hours data for the values to be properly computed. The indicator requires extended trading data in order to properly compute the levels in those labels.
Pete,
After reading that there wasn’t enough post market data on OLED, I used SPY instead and watched that in real time post market. Then the light bulb went off and I understood what was happening, seeing the text numbers change as post market activity occurred. Thanks a bunch for your help!
Brook
I get a sound alert when viewing the symbol chart, is there a way to have it alert when it makes it to your watchlist and it triggered?
It is not possible to generate any alerts from a custom watchlist column.
Hi, I love this website and all of the work you put into it Pete! Thank you. I have a question about the High Low Version 2 Study. I am trying to use it for identifying the (initial) high of day and low of day at the opening (before the first pullback or bounce if it’s in an early downtrend). I have a couple questions if you can help.
1) Is there any way to only apply the “Hi” label to the last “hi” candle in an uptrend (all previous candles since open have all made higher highs but the following candle made a lower high)? And only apply the “lo” label to the lowest candle in a trend of lower lows but the following candle makes a higher low?
2) And also stop adding labels completely after one “Hi” is plotted and one “Lo” is plotted?
Hope that makes sense Pete. I am hoping to use this to identify the opening trend for intraday fibonacci levels.
Thanks a ton!
That would require quite a lot of modifications to get that working. And I would need to see a screenshot in order to completely understand your request. I would normally direct you to post a question in the Q&A forum where I provide free assistance. However I believe this will require a bit more time than I permit when solving requests in the forum. You can submit this as a project request. Full details about our rates and how the process works are explained here: https://www.hahn-tech.com/about/
Hello Pete,
Thank you for this. I tried to copy and paste into the study /open shared item
Is there any way to get this script to display yesterday’s high and low as labels?
Yes there is a way. But once we published a video we don’t make changes unless to correct errors. Please search our Q&A forum to see if someone has already requested previous day high and low labels. And if you don’t find a post for that, go ahead and post your own question requesting it.
Great! I’ve been trying to solve how to create TOS price alerts for the premarket and after hours, but it seems impossible. Any idea how you can do that? Thanks!
Have a look in our Q&A forum. I know this is a popular question and there are probably a few solutions already posted.
Hi Pete!
Thanks for your answer. I’ve been watching videos and reading the Q&A, and also searched “alerts” as a keyword. I didn’t find specifically what I’m looking for. I was hopefully looking for a workaround, because TOS alerts are not working for extended hours, only for market hours. There’s nothing when you set the alerts that will allow you to use “Extended hours” for the alert. And what I want is an alert for extended hours.
So I take you are using a price level alert? Because you also have Study Alerts ans Scans that you can use to get alerts that trigger during extended hours trade.
Yes, Pete. I’m trying to use price alerts. A simple alert to receive when the price reaches a certain level, regardless of if it is extended hours or premarket or after hours. I never thought that a study or scan alert could trigger in extended hours. Maybe that could be a workaround?
Plenty of examples in the Q&A forum. Just focus on two topics. “Stock Scanners” and “Alerts and Notifications”. Search within those for more specific terms.
Thanks so much, Pete!
great website! and just what i needed!
however, ToS wont let me create a study alert, is there something i am doing wrong in this case?
I have no way of knowing without seeing a screenshot of what you are trying to do, and what happens when you try to set the Study Alert. You can post a request in our Q&A forum and include screenshots showing what is not working. Thanks.