Finally, an Alert Based on TTM Trend
Responding to numerous requests from viewers like you, this video shows how to add an Alert to the TTM Trend.
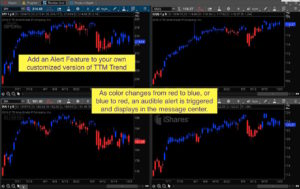
Thinkorswim Alert TTM Trend
The TTM Trend is a licensed Study listed in Thinkorswim under the category name John Carter. For some reason the built in version does not provide audible alerts when the colors change from red to blue and back again. Well fortunately Thinkorswim provides a way to accomplish this without violating any copyright laws.
In this brief video you will see how the TTM Trend indicator is referenced from inside a custom study. We’ll explain how this is possible and then show you how to simply add a few lines of code to include the Alert feature.
Lean More:
Would you like to learn how to master the chart settings on Thinkorswim? Click here for our 3 part series: Thinkorswim Chart Settings Tutorial
DISCLAIMER: I AM NOT A CERTIFIED FINANCIAL ADVISOR AND NOTHING IN THIS VIDEO OR TEXT IS AN ADVERTISEMENT OR RECOMMENDATION TO BUY OR SELL ANY FINANCIAL INSTRUMENT. NOR IS THIS VIDEO OR TEXT INTENDED TO INSTRUCT YOU ON HOW TO MAKE BUY OR SELL DECISIONS USING ANY OF THESE INDICATORS.
*Thinkorswim is a chart analysis platform offered by Charles Schwab: https://www.schwab.com/
Charles Schwab provides financial services including the trading of Stocks, Futures, Options and Forex.
Please be sure to share this page with your friends and colleagues. Leaving comments below is the best way to help make the content of this site even better.
Watch the video, Thinkorswim Alert TTM Trend below:
input compBars = 6;
input paintBars = yes;
def upTrend = TTM_Trend(compBars, paintBars).TrendUp;
def downTrend = TTM_Trend(compBars, paintBars).TrendDown;
def bullReversal = upTrend and downTrend[1] == yes;
Alert(bullReversal, "Bullish Trend", Alert.BAR, Sound.RING);
def bearReversal = downTrend and upTrend[1] == yes;
Alert(bearReversal, "Bearish Trend", Alert.BAR, Sound.RING);
Pete, is there a way to trigger this alert without switching to the symbol in TOS? Idea is that I have 10 stocks in my watchlist and I would like to get an alert when any of them get the TTM Trend Alert you helped us create here. I could then switch over to that symbol on my chart. Is this possible?
Yes, and the best place to search for solutions like this is in our Q&A Forum. And using the search function in our Q&A Forum I was able to locate the solution you are seeking within just few seconds. Here is the link: https://www.hahn-tech.com/ans/is-it-possible-to-add-custom-sounds-to-custom-study-chart-alerts-in-tos/
Hey Pete I was wondering if you can create one for the Hieken ash i or Renko charts with arrows and a scanner that can scan for stocks changing renko color bars after a series of red or green candles.
Is it possible to have it for all time frames also l. I would be more than happy to know if this is possible, especially if we can get the alerts sent directly to our phones based on the watch list we select.
Heiken-Ashi bars? yes. Renko bars? Not possible in the current version of Thinkorswim. Check our Q&A Forum when you have questions like this. There are over 2,000 questions posted there and a very large group of solutions have already been provided for Heiken-Ash bars. Here is a direct link to search results in our Stock Scanner topic: https://www.hahn-tech.com/ans/cat/scans/?question_type=all&category=https%3A%2F%2Fwww.hahn-tech.com%2Fans%2Fcat%2Fscans%2F&search=Heiken
Hi Peter there is a way you can make a TMF for the TTM squeeze but for the histogram ? I have the one for the Dots but i culd not find one the show the color for the histogram . thanks what you do is very helpful
I have no idea what “TMF” stands for. But if you have found the video for the TTM_Squeeze Dots then you will find the one for the TTM_Squeeze Histogram is listed immediately above it in the left-hand sidebar, under the TOS Watchlists topic.
Pete, thanks for this! is very helpful. Is there a way to add the alert into the watchlist?
It is not possible to generate alerts and notifications from within a custom watchlist column. But it is possible to display the colors of TTM_Trend in a watchlist. This was already requested and solved in our Q&A Forum here: https://www.hahn-tech.com/ans/could-a-custom-color-code-column-be-made-for-the-ttm-trend/
If you are looking to setup up notifications for a list of stocks you can build a custom scan and use that to create a dynamic alert. Details here: https://www.hahn-tech.com/thinkorswim-scans-beginner-to-advanced/
Copied the code as per your instructions but except for some red telephones and blue lightbulb indicators I have no alerts. I wish it had worked but mine does not work, at all.
Well it either works or it doesn’t. And if it doesn’t that most likely means you have not setup any of the notifications settings for your platform. Top right corner: Setup –> Application Settings –> Notifications
It seems as if the window in TOS 2020 is different than what shows up in your video in 2016. Also I can’t get the plot and the chart graph to show up in the same window. I can scroll way up and get plot but when I scroll down obviously the plot disappears. Do you have any ideas as to what is happening?
Tough to assist without a screenshot. The only thing that comes to mind is a chart setting named “Fit studies”. It’s listed under the “General” tab of the chart settings. Uncheck that if it’s checked and see if that clears up the chart. If not, consider posting a new question in the Q&A forum were you can provide a screenshot showing what you see on your chart.