This version has been replaced by new versions located on the following webpages:
Standard Divergence: https://www.hahn-tech.com/thinkorswim-standard-divergence-v4/
Hidden Divergence: https://www.hahn-tech.com/thinkorswim-hidden-divergence-v2/
Thanks to a huge response and feedback from our viewers we are very excited to publish version three of the Divergence Premium indicators for Thinkorswim. Along with the new version we have published a video titled “Thinkorswim Divergence Lines Upgrade”. We are also including a custom scan along with the upgraded version. Customers who already purchased version two are receiving the upgraded version at no extra charge! In this video we show how to adjust the settings and run the scan. And there is a live chart demo showing how the chart based alerts function. At the request of viewers, we have also added a companion study, available separately. The companion study measures divergence in a different way.
- Indicator Type: Momentum
- Indicator Basis: Price momentum diverging from price action
- Time Frames: All supported time frames and aggregation periods
- Trade Setups:
- Trend reversals
- Taking profits
- Scalping
We realize there are many techniques employed for reading divergence. We tried to be as accommodating as possible within the limits impose by the Thinkscript language. I’m sure you will be very excited to see the new ways these indicators can be customized to fit your needs.
Need more information?
To get pricing and see how to place your order click the link below.
Thinkorswim Premium Trading Tools
Please be sure to share this page with your friends and colleagues. Leaving comments below is the best way to help make the content of this site even better.
Watch the video, Thinkorswim Divergence Lines Indicator below:
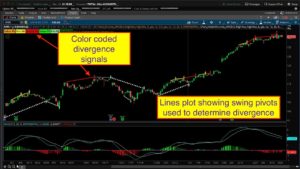
Technical description of how the code works:
The code is designed to locate swing pivots in price. This is the first step. The swing pivots are defined using a default lookback period of 3. Increasing the lookback period causes the code to locate larger structures (macro as opposed to micro). The swing pivots are set by default to compare highs and lows. This can be adjusted to compare the close of each candle instead of the high/low. When plotted, each swing pivot is marked with a blue square.
For each swing pivot, the code compares the value of the lower study at the current swing pivot to the value of the lower study at the previous swing pivot. Lower swing pivot with a higher price momentum will generate a positive divergence signal. Higher swing pivot with a lower price momentum will generate a negative divergence. The default is to compare (on the price chart) low to low and high to high, in order to determine if swing pivots are higher or lower. This behavior can be adjusted so that the comparison is made from close to close.
Before requesting to purchase any of these indicators it is very important that you watch the demo video, otherwise you will not have the knowledge needed to adjust the indicator settings to get the behavior you seek.
DISCLAIMER: I AM NOT A CERTIFIED FINANCIAL ADVISOR AND NOTHING IN THIS VIDEO OR TEXT IS AN ADVERTISEMENT OR RECOMMENDATION TO BUY OR SELL ANY FINANCIAL INSTRUMENT. NOR IS THIS VIDEO OR TEXT INTENDED TO INSTRUCT YOU ON HOW TO MAKE BUY OR SELL DECISIONS USING ANY OF THESE INDICATORS.
*Thinkorswim is a chart analysis platform offered by TD Ameritrade: www.tdameritrade.com
TD Ameritrade provides financial services including the trading of Stocks, Futures, Options and Forex.
Hi, is the standard divergence RSI works for timeframe weekly or dayly or 4h?, i did no see this examples in video
I have not found a time frame that is not supported by these indicators. There is nothing in the code that is based on date/time information. It only measures changes in values over specified number of bars. If you would like to see something specific you can fill out the order form and request specific screenshots in the questions/comments section of the order form.
Hello, not sure if this is the place to ask this question. Do you have indicators with buy/sell signals?
Sorry but no. None of our premium studies provide buy and sell signals. The only studies that would provide buy and sell signals are not studies at all. Rather they are more accurately referred to as “Trading Systems”. A trading system incorporates many different indicators and patterns into a signal “system” or “trading setup”. Any trading system you might find must also include the ability to backtest and optimize it’s performance using various user inputs settings. When you find one that can produce consistent trading profits you should expect to pay several hundred dollars or more.
Thank you so much for the prompt response. Are you willing to code a Trading System for me? If so, How much would a project of that magnitude cost me?
Yes, this is a service we offer. You will need to provide the full list of specifications. Our only job is to write the code based on the specifications you provide. You can submit a project request by filling out the contact form at the bottom of the About page. Be sure to read all the details on that page before submitting your project request: 2/26/2020
Thank you. Unfortunately I don’t know enough about trading yet to know what specifications I would need to even start a trading system. Perhaps one day i will know enough to provide the specifications and move forward with this project.
Please take the time to read the following articles. They will save you a great deal of pain and suffering. Never purchase any trading indicators until you have trading profits to spend. Trading indicators can never make an unprofitable trader profitable.
https://www.hahn-tech.com/learning-how-to-trade/
https://www.hahn-tech.com/strategies-winning-percent-versus-risk-reward/
https://www.hahn-tech.com/automated-trading-systems/
Hello, would it be possible to create a divergence study using the OBV and Chaikin Money Flow?
Yes, I have created several customized versions of our divergence studies for clients. After purchasing the standard version there is a modification fee to create the customized version that you require.
Hi Hahn,
Is does RSI Hidden divergence lag by 3 candles to confirm the divergence?
Ive seen your video but I couldnt tell if it confirmed the line after the 3rd candle.
I mainly use Daily chart so I assume that if I use it as a scan, the confirmation would come up 3 days after it already happened.
No, the right side strength of the swing pivots is 1 bar. The divergence signals are locked in at the close of the bar that immediately follows the divergence signal.
Awesome, 2 more questions.
Does it catch both bullish and bearish hidden divergence?
And is it both an upper and a Lower study?
Positive and negative divergence. Yes. The divergence studies only plot on the upper price graph and no lower sub graph.
Last Question Hahn,
I’m mainly looking for posible trend continuation using hidden divergence. Which hidden divergence did you use on this video at the 21minute mark,
Was it the MacD or RSI hidden divergence?
I have no idea. Not at the computer today so I can’t view it at this time. The name of the chart study should be displayed on the tittle bar of the chart. And I probably matched the hidden divergence with the lower study so that it would be clear which divergence was being measured.
Nice videos. Its good to know you are better. Q: How can you detect when hedge fund get in the market?
Thanks. But I don’t have the slightest idea how to detect when hedge fund get in the market. From what I hear, hedge funds are folding are a record rate. Stocks have been going straight up for well over a decade and nobody really needs a hedge fund anymore. That’s what I hear anyway.
hi do you have any good indicators for day trading, i would like to buy it
None of our premium indicators are designed for specific trading styles, trade durations or time frames. All of our premium indicators are designed to be adjustable to fit the widest possible audience.
Hi Can you do a create a divergence scan using the force index in TOS on daily charts of stocks?
We have created several modified versions of our divergence studies for clients. The modification fee to swap out one of the two lower studies is $75 USD (after paying the full price for the premium study). The ForceIndex is an oscillator type study and therefore is a candidate to be added to our divergence studies.
ok thanks. where can i find info on the hidden divergence indicator? I tried searching online however i couldn’t find much.
Did you watch the demo video yet? Hidden divergence is covered in detailed.
I am looking for a “scan” program for TOS to locate candidates that have experienced divergence bottoms or tops and can be scanned in any time frame (ex. 15 min, 1 hour, daily, weekly etc.) and return a list of those symbols which have met the criteria. It can be based on divergence with MACD or RSI…… Also, if you are familiar with the Connors “Turtle Soup” setup, which is also basically a divergence setup that does need to be used along with any indicators, that would also be ideal.
Do you have any scans that can screen for any of these conditions?
Did you watch the entire demo video for this indicator? Because in this video we do demonstrate that the indicator includes code to run scans for divergence signals. I have no knowledge of “Connors Turtle Soup” so i have no comment on that.
Hi. Does the divergence line include the capability to use ToS scan to find stocks that fit the criteria? If not, is it possible code ToS scan to find stocks that fit the divergence line code? Thanks.
You really need to watch the entire video. If you have any questions that are not covered in the video I will be more than happy to answer them. The demo video serves as the entire use manual for this indicator so it is absolutely essential you watch the entire video from start to finish.
Thanks!
Hi Pete, Just view your you-tube video on MACD RSI SQUEEZE with the pivot point indicator. It was great. When I contribute the $5.00 do I receive the indicator code and the scan for TOS. Thanks [email protected]
No. contributions are entirely voluntary. I went to great lengths to make sure there was no way to confuse that. Viewers who leave a contribution receive absolutely nothing in return. It’s basically a tip jar. When one of our videos provides free code. The code is indeed free. Just find the link inside the video and download it. Keep in mind you have left this comment on a video for one of our premium indicators. So this video in particular does not provide any free code to download.