Build Custom Scans, Alerts and Chart Studies Using Thinkorswim Condition Wizard
Wouldn’t you love to be able to create highly complex scans, alerts and chart studies? Frustrated from spending endless hours trying to learn how to write code? In this video, I show you how to use the Thinkorswim Condition Wizard to build highly complex alerts, scans and 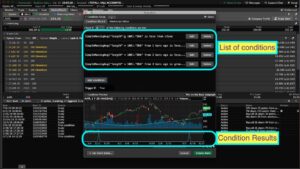 chart studies. We start by showing a very basic example but we cover every detail so you won’t get lost. Then we progress to more complex solutions through a series of 5 examples. Each example is taken directly from posts to our Q&A forum. These are real world examples, posed by real traders just like you.
Lean More:
Would you like to learn how to master the custom scan tools on Thinkorswim?
Click here: Thinkorswim Scans Beginner to Advanced
Examples included in this video:
- Identifying stocks where the TTM_Wave C is light blue
- Stocks above simple moving average the previous 3 bars
- Three consecutive bars of 2% or more gain
- Unusual option volume
- MACD crossover below the zero line
Want to learn more?
Once you master these techniques, be sure to view our advanced Strategies video: Thinkorswim AutotTade Almost . This video explains how to use the Thinkorswim Condition Wizard to build chart strategies and conditional orders for automated trade execution. Also included are code templates. Which make it very easy to copy code from the Thinkorswim Condition Wizard and paste it into your own custom chart strategy.
For a complete understanding of Thinkorswim Chart Strategies be sure to view all our videos in this topic:
*Thinkorswim is a chart analysis platform offered by TD Ameritrade: www.tdameritrade.com
TD Ameritrade provides financial services including the trading of Stocks, Futures, Options and Forex.
Please be sure to share this page with your friends and colleagues. Leaving comments below is the best way to help make the content of this site even better.
if U can help . explanation of what i am looking for . 2 Accounts 1 script on both Accounts same CHART setup on both . 1 ACCOUNT Long Trades the other SHORT’S to Hedge . BUT do not want the short til the Long Trade is Bought . can this function be added to the Script .
What you describe is not possible in to do on Thinkorswim. There would be no way for the script applied to one account to be aware of what has taken place on the other account. The best you might hope to achieve is to construct your script to include both long and short triggers. Then add statements to that code which would prevent the short signal from triggering until the long signal has triggered. But then you run into the problem of having to use recursion. So I doubt anything like this can be accomplished using Thinkorswim.
I am brand new to TOS – Schwab moving over to platform. It is much more powerful and complicated than I am used to. I like to purchase stocks which are trading at least 5% below their 15 day SMA. I found the right scan to find these stocks, but I cannot figure out how to sort them by % below the SMA. I have been trying to find the solution for sorting here on your website, but am having difficulty. It would help me in my trading strategy if you could advise about sorting this way. Thank you and I am sorry if you have answered this question and I just couldn’t find it. I love your teaching videos. Thank you.
Well first let me say welcome to Thinkorswim. It is a bit overwhelming because of all the many features. And this website and my YouTube channel are designed to help folks get the most from the platform. We focus on the four most commonly used sections of the platform: Charting tools (studies & strategies), Scans, and Watchlist columns. You will find all of our videos are organized here by those topics.
In order to get the most from this website I suggest you view our introductory video, which is located under the help menu at the top of our site. Here is a direct link to that resource: https://www.hahn-tech.com/introduction-video/
In regards to sorting scan results in the way you described. Yes, this is absolutely possible to do on Thinkorswim. But the solution is a bit difficult to figure out on your own. There is a post in our Q&A Forum which describes how this is done. I suggest you start by viewing that solution and building it yourself using the custom script which is included: https://www.hahn-tech.com/ans/scan-for-percentage-change-since-open/
When you are ready to build your own custom scan based on the metrics you described, please consider posting a request in the forum so I can provide a more detailed response than is possible here in the comments section of this webpage. The introductory video will explain how to log in, post new questions and navigate the site.
Hope that helps!
Hello Pete,
I have a question regarding my custom watchlist. I would like an SMS alert sent every time this this triggers. let me know if this is possible.
“MovAvgExponential(“length” = 200).”AvgExp” is less than close and MovAvgExponential(“length” = 200).”AvgExp” from 1 bars ago is less than close from 1 bars ago and MovAvgExponential(“length” = 200).”AvgExp” from 2 bars ago is less than close from 2 bars ago”
Best place to find answers to questions like this is in our Q&A Forum. We have an entire topic dedicate to custom watchlist columns: https://www.hahn-tech.com/ans/cat/watchlists/
However the tool that allows you to trigger sms alerts for a list of stocks is actually the custom scan tool. Details here:
https://www.hahn-tech.com/thinkorswim-scans-beginner-to-advanced/
Thanks so much for this lesson, I learned a lot about the versatility of thinkscript in different areas of ToS! I created my own custom watchlist alert using the condition wizard, and am trying to figure out how to assign a color and/or label to the “1” value (versus 0 because it’s an on or off condition). I’ve tried borrowing from other bits of code with labels and colors but can’t figure out how to define/reference the on or off (0 or 1) condition so as to apply a label/color. Any insight is much appreciated! Here is the code for the alert:
MACDHistogramCrossover(“crossing type” = “Negative to Positive”) is true within 10 bars and RSI().”RSI” is less than or equal to 50 within 10 bars and close crosses above MovAvgExponential(“length” = 20).”AvgExp” within 3 bars
Fortunately for you there is another video on this topic specifically addressing custom watchlist columns: https://www.hahn-tech.com/thinkorswim-condition-wizard-watchlist/
I also suggest you check out some of the solutions already posted in the “Watch Lists” topic of our Q&A Forum: https://www.hahn-tech.com/ans/cat/watchlists/
Wow, yes that is EXACTLY what I was looking for! Got the customization up and running, thank you again!
I want to scan while in premarket, all symbols that premark price are %20 higher than Previous Day Close.
Afterhours_change, and gap_up studies doesn’t fit those criterias.
So, I tried to simply reuse the code for study “Previous Day Close” as this
CODE:
——
input percent_change = 20.00;
def pdc = PreviousDayClose();
def precio = high(“period” = AggregationPeriod.DAY, “priceType” = PriceType.LAST);
input aggregationPeriod = AggregationPeriod.DAY;
input length = 1;
input displace = -1;
input showOnlyLastPeriod = no;
def PrevDayClose;
if showOnlyLastPeriod and !IsNaN(close(period = aggregationPeriod)[-1]) {
PrevDayClose = Double.NaN;
} else {
PrevDayClose = Highest(close(period = aggregationPeriod)[-displace], length);
}
plot scan = precio >= (((percent_change)/100)+1)*pdc;
——–
But error arraises “Seconday period not allowed: DAY”
And if change that period by removing it, doesn’t work as spected.
I imagine that this simple scanner has to be ready made but I couldn’t find it.
Any help to achive my goals ?
Thank you!
This request is entirely unrelated to the context of this video so it will be removed. Secondary aggregation periods are not supported in the Study Filters of custom scans and there is no way to work around this limitation.
There is no ASK or BID like on the clip, how to keep track what is the lowest price of the day and what is the current market price?
Lowest price of the day is “low” when set to the daily time frame. Current price is always “close” regardless of time frame. I don’t recall using the Ask or Bid in this video. Can you tell me where in the video you found that?
20:15 but it is for alerts, i guess it is different for condition.
So basically if i undaunted correct to make scan that can show me if the lowest price of stock is above specific price and below currant market price i have to: plot scan = low > 10 and close < 11;
One recommendation, add edit 😛
Thx Pete, i just tried it and it worked!
Happy new year and all the best to everyone 😉
Awesome, glad you know you got it working!
I just need a scan that can show me if the lowest price of stock is above specific price and below currant market price :/
That is actually much easier to build then any of the examples provided in the video. Just keep practicing using the examples I provided and you will learn how to do the simply scans as well.